Transparency Criteria #19 for the proxy states:
The proxy summary or introduction to election of directors proposal includes graphics presenting, at a minimum: ages; tenures; genders; and race/ethnicities of the full board.
This one goes in tandem with the board summary table, a topic that I recently blogged about. Like the board summary table, it allows shareholders to get a sense of the board in a snapshot. Much of the information provided in the board demographic summary has been eagerly sought by investors for the past few years and highlighting the information helps to meet those investor expectations.
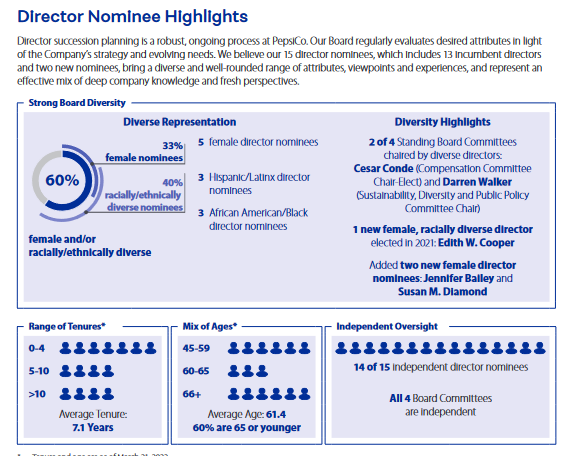
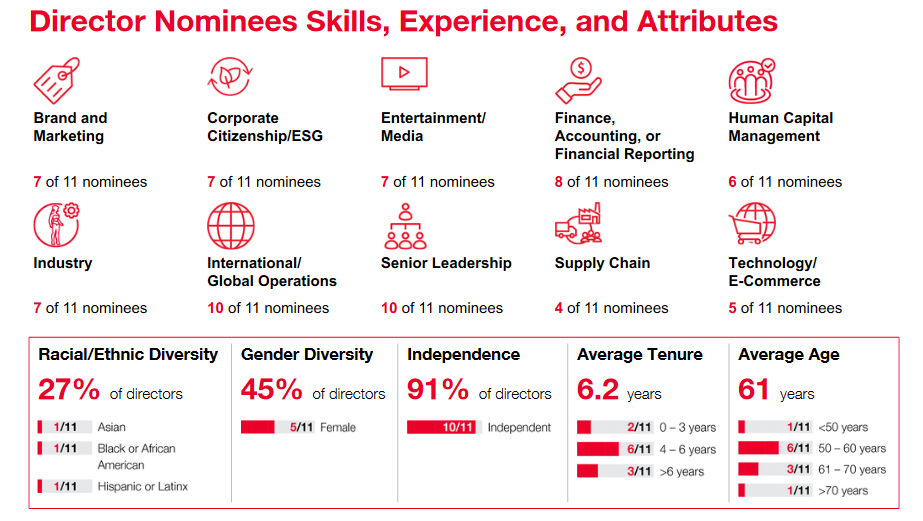
In the board demographic summary, the company rolls up the information and does the math for shareholders on the ages, genders, race/ethnicities, and tenures of the directors so shareholders don’t have to slug individual director bios to piece that information together.
There is some flexibility here. Sometimes it’s in tabular format. Sometimes it’s another type of visual summary – like a two-page spread.
For a good example of this table, see Pepsi’s 2023 proxy (page 7):

And here’s one from Mattel’s 2023 proxy (page 15):

Some companies disclose the average tenure or average age of the board. Most companies provide a graphic indicating how many directors on the board are female – and how many are from an ethnically diverse background. Some of these companies then provide a third graphic to indicate how many of the directors fall within these first two graphics to give a better illustration of how diverse the board truly is since some directors might be counted twice (for example, an African American woman on the board).
Even if a company isn’t quite where they want to be with their board in terms of their demographics, it can still show how much change has taken place over the past few years so that investors can understand the direction the company is going in terms of changing its board composition. There is a story to tell…and hopefully, it’s a good story…


